

Ethereum exchange-traded funds have outpaced Bitcoin ETFs, recording a massive $240.29 million in daily net inflows on Wednesday that eclipsed Bitcoin ETFs’ $164.57 million, marking the 18th consecutive day of positive flows into spot ETH ETFs.
This surge represents the highest single-day inflows for Ethereum ETFs in four months. It coincides with ETH’s climb above $2,800 for the first time since February, pushing the asset to a 12-day high.
The remarkable momentum began building in early June when Ethereum staking reached an all-time high of 34.65 million ETH locked on the Beacon Chain. This represents nearly 29% of the total circulating supply and shows a long-term conviction among holders who chose to stake rather than sell.
Institutional Capital Rotation Drives Ethereum Momentum
According to the data from SoSoValue, BlackRock’s iShares Ethereum Trust (ETHA) has emerged as the top gainer, leading Wednesday’s inflows with $163.6 million, maintaining a 23-day streak without outflows, and managing over 1.55 million ETH valued at $4.23 billion.
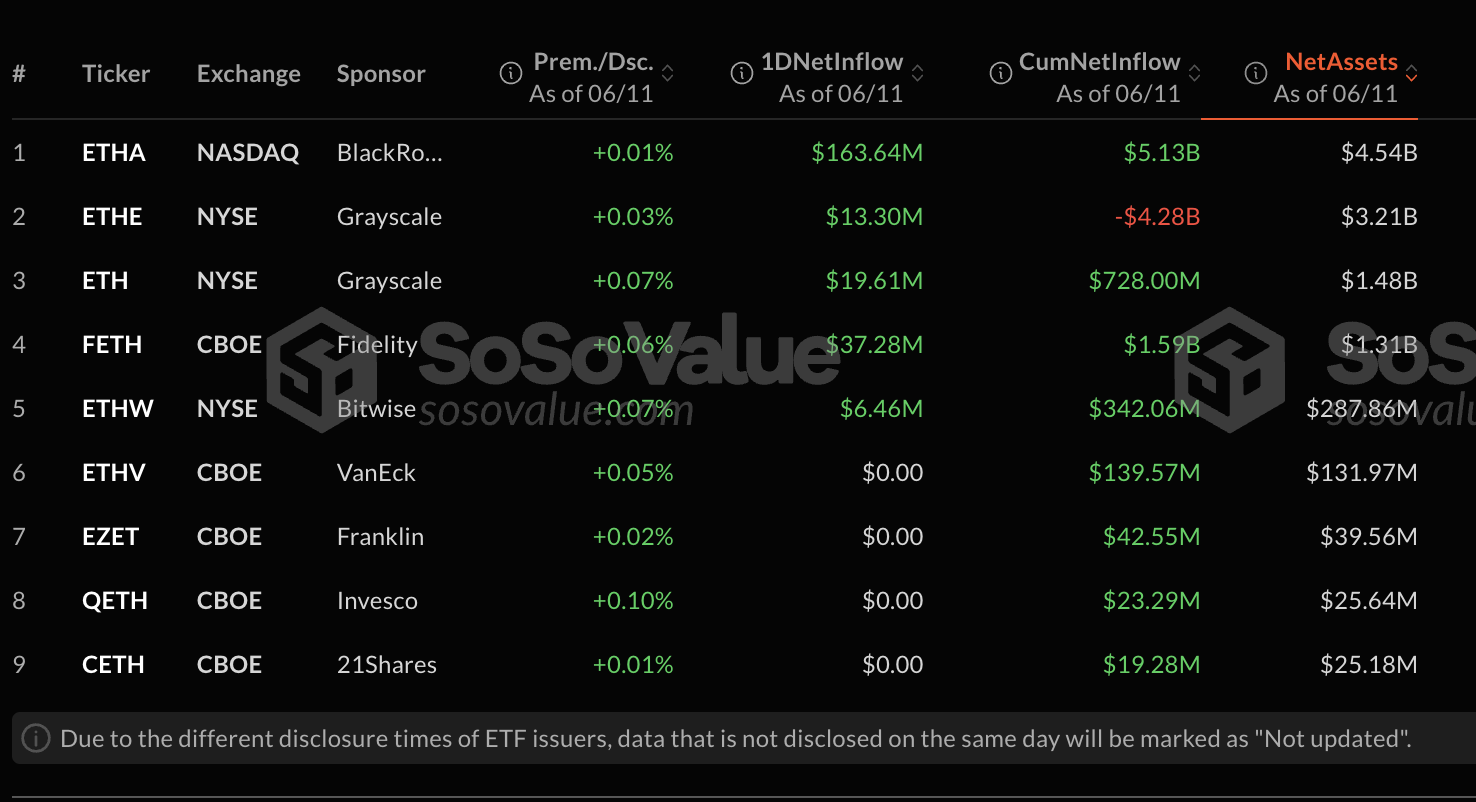
The fund’s stock price has surged over 50% since the start of the year, and cumulative Ethereum ETF inflows have totaled $3.74 billion since their July 2024 debut.
Notably, the new administration’s recent regulatory shifts were among the key factors of this renewed confidence in Ethereum’s ecosystem, particularly as the network’s Pectra upgrade has addressed long-standing scalability and cost-efficiency challenges that previously hindered developer adoption.
In fact, Ethereum co-founder Vitalik Buterin, speaking at ETHGlobal, recently predicted that the network’s transaction processing capacity will improve tenfold over the next year through layer-1 scaling solutions.
The dramatic surge in Ethereum ETF inflows has made investors increasingly view ETH as undervalued relative to Bitcoin’s recent all-time highs and the broader altcoin rally that peaked last year.
Technical Breakout Patterns Point Toward $3,000 Target
Ethereum’s price action reveals an interesting technical pattern across multiple timeframes.
The weekly Elliott Wave analysis displays a comprehensive five-wave impulse pattern from the 2022 lows. The most critical development was Ethereum’s recent breakout above the massive descending trendline, which contained price action since the 2021 all-time highs.
This structural break confirms the end of a multi-year accumulation phase marked by a High-Volume Flag pattern throughout 2023, during which smart money built positions while retail sentiment remained bearish.
The daily chart reveals a completed inverse head-and-shoulders pattern, with the current price at $2,772 showing strong upward momentum after decisively breaking the red descending trendline that previously acted as resistance.
The pattern projects near-term targets around $3,300 with a more ambitious second target approaching $4,000. At the same time, the step-like structure suggests the advance may involve consolidation periods at key resistance levels before continuing higher.
Perhaps most compelling is the comparative analysis showing Ethereum repeating Bitcoin’s 2018-2021 cycle almost exactly. Both assets exhibit nearly identical patterns of prolonged bear markets followed by base formation around their respective 1-week MA50 levels.
The current Ethereum pattern mirrors Bitcoin’s sequence from the COVID crash through explosive recovery to new all-time highs, positioning ETH similarly to where Bitcoin was in early 2020.
If this historical precedent holds, Elliott Wave projections extend to $5,917 and potentially $13,822, representing a dramatic expansion from current levels.
Short-term technical indicators present a mixed but ultimately constructive picture as Ethereum trades at $2,771 after briefly breaking above the critical $2,800 resistance zone that has capped price action since early May.
However, recent rejection from a high of $2,834 suggests ETH may enter a short-term retest phase, with the $2,750-$2,800 zone now acting as immediate resistance.
The MACD remains bullish but is flattening, hinting at potential near-term consolidation. Critical support levels to monitor include the $2,680 zone representing the 50% Fibonacci retracement level, with deeper support at $2,620 and $2,550.
For the bullish scenario to play out, Ethereum must decisively break above $2,880 resistance to trigger the next major leg toward $3,000 and beyond. If the Bitcoin comparison proves accurate, ultimate cycle targets will reach well into five-figure territory.
The post Ethereum ETFs Smoke Bitcoin ETFs with Massive $240M Inflows – $3K Breakout Next? appeared first on Cryptonews.

