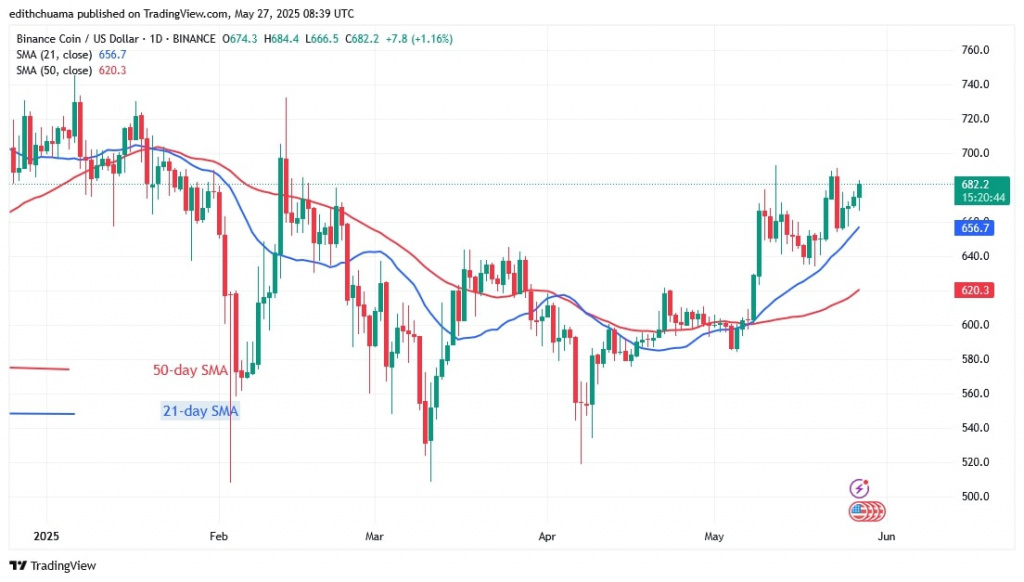
The price of Binance Coin (BNB) is moving sideways above the moving average lines but below the $690 level.
BNB price long-term prediction: bullish
Buyers have been working feverishly since 9 May to push the price above $690, as reported by Coinidol.com. Binance coin has been trading above the 21-day SMA but below the $690 level for the past two weeks.
Now, if buyers push the price above the $690 mark, BNB will rise to highs of $730 and $745.
However, if the token continues to fall from the resistance zone, the sideways movement will continue and it will fall above the 50-day SMA or the $600 support.
BNB indicator reading
The rising trend makes BNB’s moving average lines appear horizontal but upward sloping. The price bars are above the upward sloping moving average lines. The altcoin continues to rise slowly as doji candlesticks continue to drive the price action.
Technical indicators:
Resistance Levels – $600, $650, $700
Support Levels – $400, $350, $300

What is the next direction for BNB/USD?
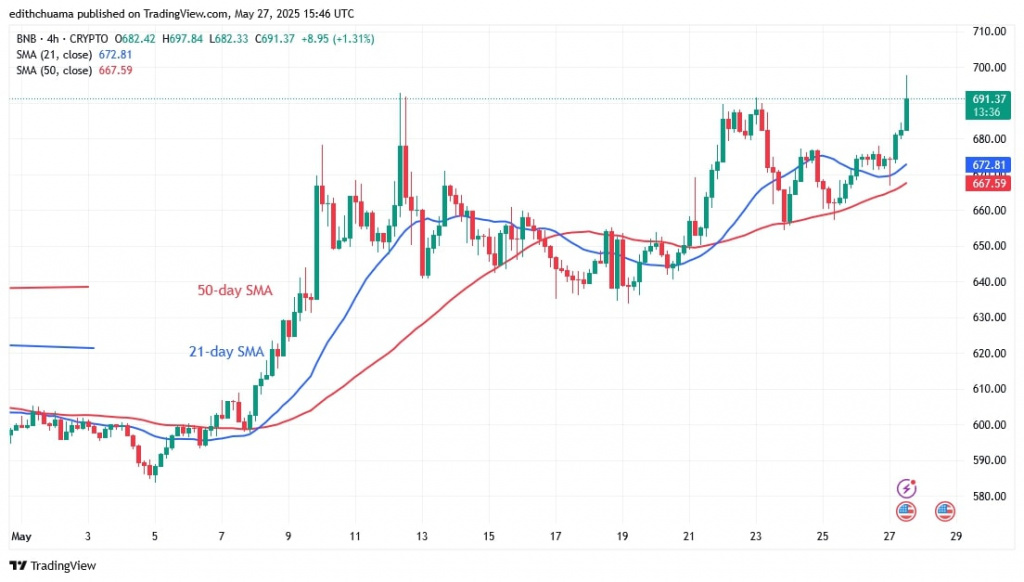
The price of BNB has resumed its horizontal trend after the price rally on 8 May. After striking the resistance level at $690, the altcoin started to move sideways.
BNB is trading below the barrier of $690 on the 4-hour chart but above the $640 support. The price bars are currently retesting the resistance level in anticipation of a bullish trend.

Disclaimer. This analysis and forecast are the personal opinions of the author. They are not a recommendation to buy or sell cryptocurrency and should not be viewed as an endorsement by CoinIdol.com. Readers should do their research before investing in funds.


