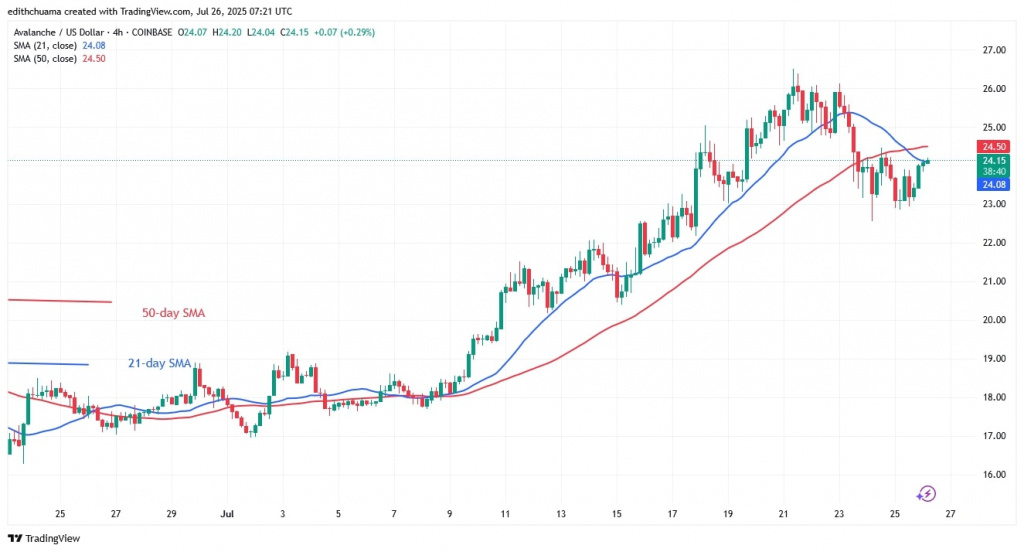
The price of Avalanche (AVAX) has maintained a sideways trend above the moving average lines.
Avalanche price long-term analysis: ranging
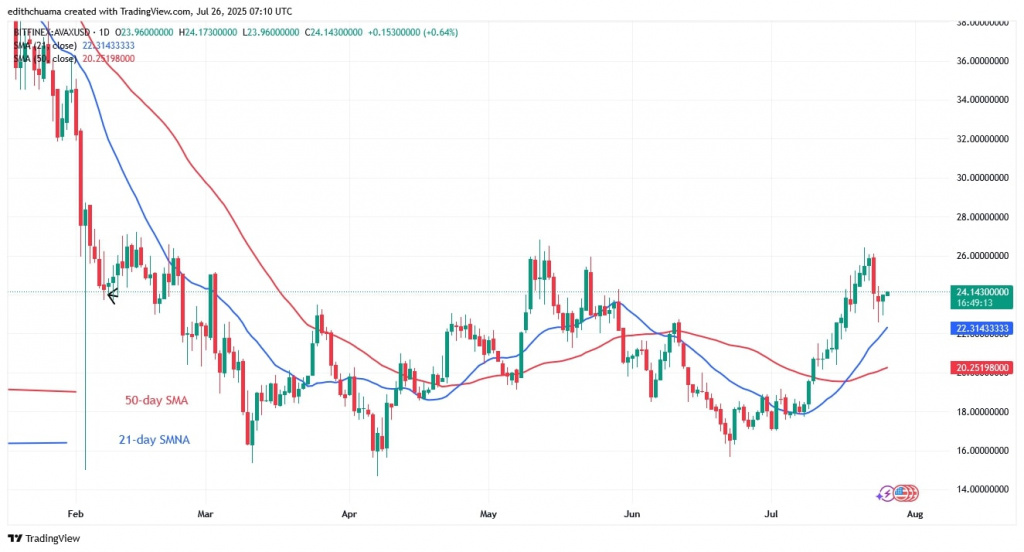
The cryptocurrency has been trading in a range of $16 to $26. On July 21, as reported by Coinidol.com, the price of the cryptocurrency broke through the $26 mark, but then fell again. The downtrend stopped above the support level of $22, also known as the 21-day SMA. AVAX has continued its uptrend and is approaching the current barrier. A break above $26 will catapult the altcoin to $45.
However, if AVAX falls below the recent barrier, the cryptocurrency will return to its range-bound movement. In the meantime, AVAX is approaching the resistance zone. The cryptocurrency is currently trading at $24.
AVAX price indicators analysis
The horizontal moving average lines are trending upwards, indicating a bullish crossover. The 21-day SMA is above the 50-day SMA, signalling an uptrend. The price bars are above the 21-day SMA, signalling an uptrend. On the 4-hour chart, the cryptocurrency’s price bars are below the moving average lines, indicating a recent decline on July 23.
Technical Indicators:
Key Resistance Levels – $60 and $70
Key Support Levels – $30 and $20

What is the next direction for Avalanche?
AVAX has been trading above the moving average lines since the breakout on July 10. The upside momentum has stalled below the $26 barrier, with the altcoin trading above the $23 support but below the recent high. The altcoin is growing as it resumes its uptrend. The cryptocurrency is attempting to break through the $26 barrier.

Disclaimer. This analysis and forecast are the personal opinions of the author. They are not a recommendation to buy or sell cryptocurrency and should not be viewed as an endorsement by CoinIdol.com. Readers should do their research before investing in funds.


