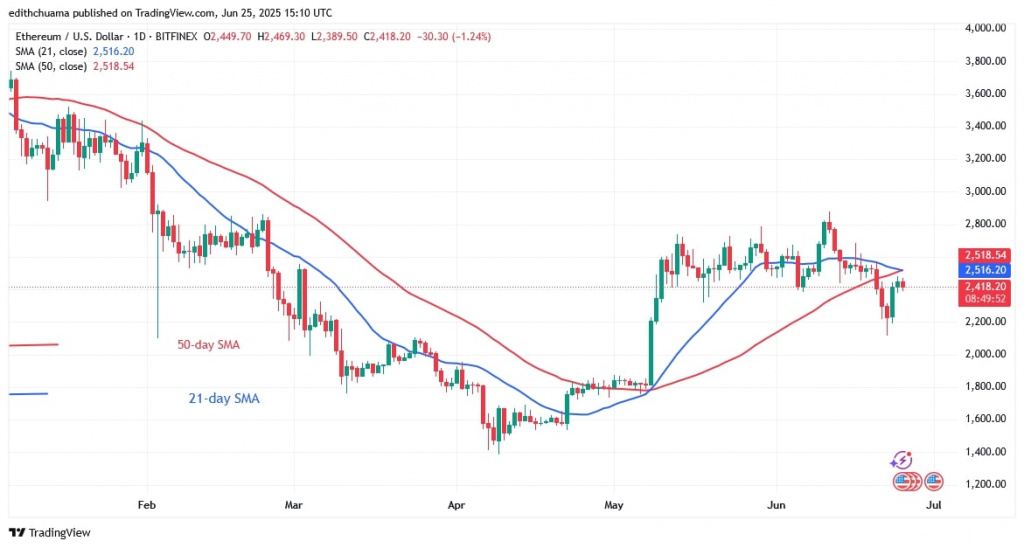
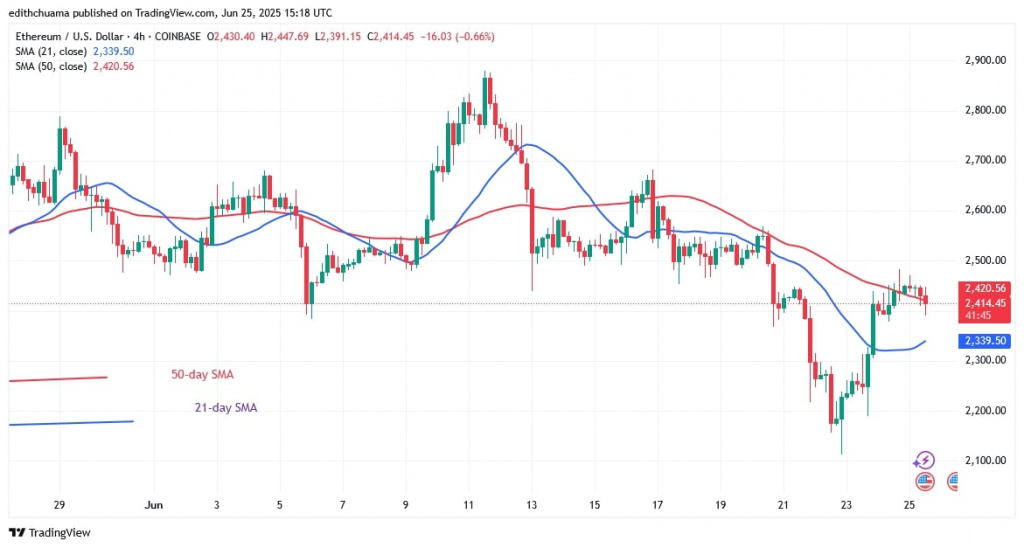
The price of Ethereum fell to a low of $2,117 on June 22. The bulls bought the dips and rose above the $2,200 support.
Ethereum price long-term analysis: bearish
The largest altcoin reached a high of $2,481, but the upside momentum ran into resistance from the moving average lines.
However, if buyers push the altcoin above the 21-day SMA, Ether will rise to a high of $2,700. But if Ether fails to break above the 21-day SMA barrier, it will fall further and breach the support at $2,100. The altcoin will continue to fall and reach a low of $1,800. Ether is currently trading at $2,399.
Ethereum indicator analysis
The price bars are below the moving average lines despite the rise above $2,400. The moving average lines on the daily chart are horizontal, and the 21-day SMA is trying to cross below the 50-day SMA. The current trend is downward, as shown by the moving average lines on the lowest time frame.
Technical Indicators:
Key Resistance Levels – $4,000 and $4,500
Key Support Levels – $2.000 and $1,500

What is the next direction for Ethereum?
Ethereum is currently bearish and trading in the downtrend zone. The largest altcoin is currently bouncing between the moving average lines and the $2,200 support.
If the largest altcoin breaks above the moving average lines, it will resume its uptrend. If buyers are unable to sustain the price above the moving average lines, Ether will fall.

Coinidol.com reported on June 23 that the price of Ethereum fell below the moving average lines and hit a low of $2,246.
Disclaimer. This analysis and forecast are the personal opinions of the author. They are not a recommendation to buy or sell cryptocurrency and should not be viewed as an endorsement by CoinIdol.com. Readers should do their research before investing in funds.


