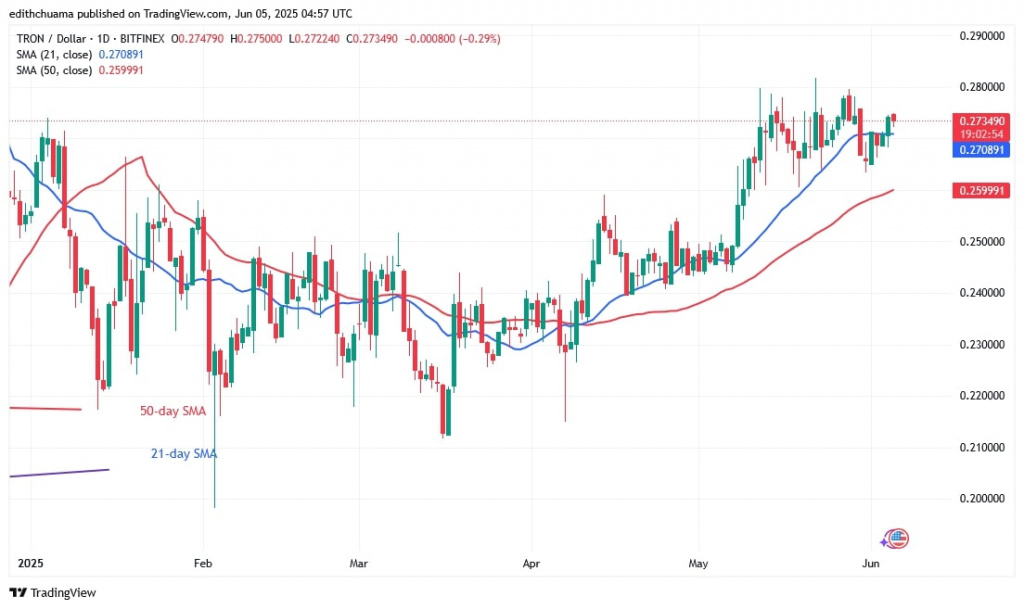
The price of TRON (TRX) has continuously fallen below the $0.28 mark since 12 May.
TRON price long-term forecast: bullish
The cryptocurrency is currently trading above the 21-day SMA support and below the resistance at $0.28. The altcoin fell as low as $0.263 on May 30, as reported by Coinidol.com, but the bulls bought the dips after the bears broke the 21-day SMA support. TRON resumed its sideways trend after rising above the 21-day SMA. TRON will rise to a high of $0.30 if the bulls gain the upper hand and break the $0.28 barrier.
However, if the cryptocurrency falls below the 21-day SMA support, the risk of depreciation increases. TRON will fall to a low above the 50-day SMA support or a low of $0.259.
Meanwhile, the price is falling but remains above the 21-day SMA support. TRON is currently worth $0.275.
TRX indicator analysis
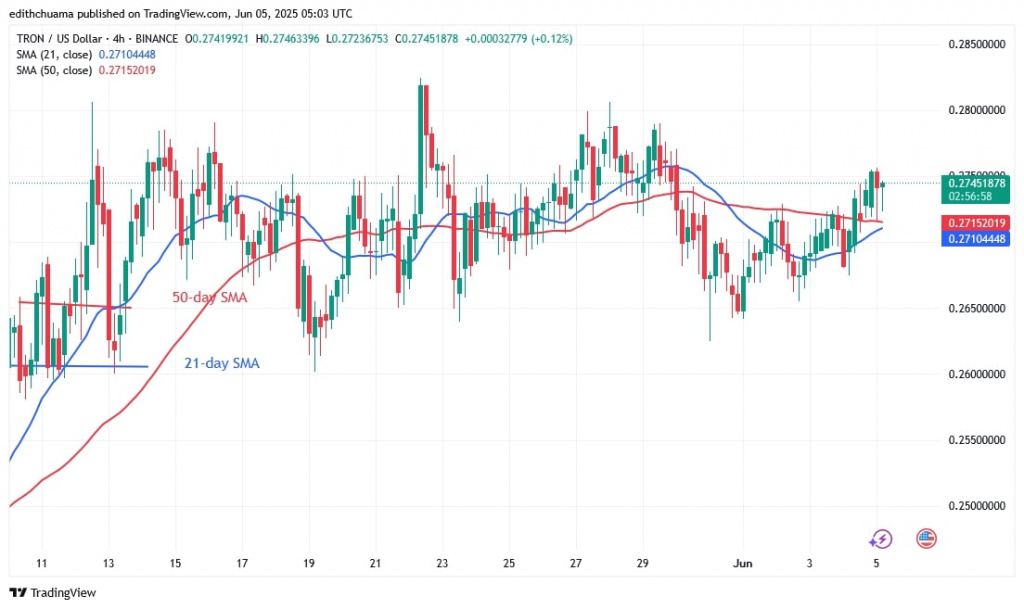
The sideways trend is now indicated by the horizontal moving average lines, which were previously pointing upwards. The price bars are currently above the moving average lines, having previously broken through the 21-day SMA support. The moving average lines on the 4-hour chart of the current trend have been horizontal since the 12th of May.
Technical Indicators
Key Resistance Zones: $0.40, $0.45, and $0.50
Key Support Zones: $0.20, $0.15, and $0.10

What is the next move for TRON?
TRON’s trend remains sideways. The cryptocurrency has been trading below the resistance at $0.28 but above the support at $0.26. Resistance at $0.275 has halted the upward momentum today.
The altcoin is now trading below the $0.275 barrier and above $0.265. The altcoin will perform once these new levels are reached.

Disclaimer. This analysis and forecast are the personal opinions of the author. They are not a recommendation to buy or sell cryptocurrency and should not be viewed as an endorsement by CoinIdol.com. Readers should do their research before investing in funds.


