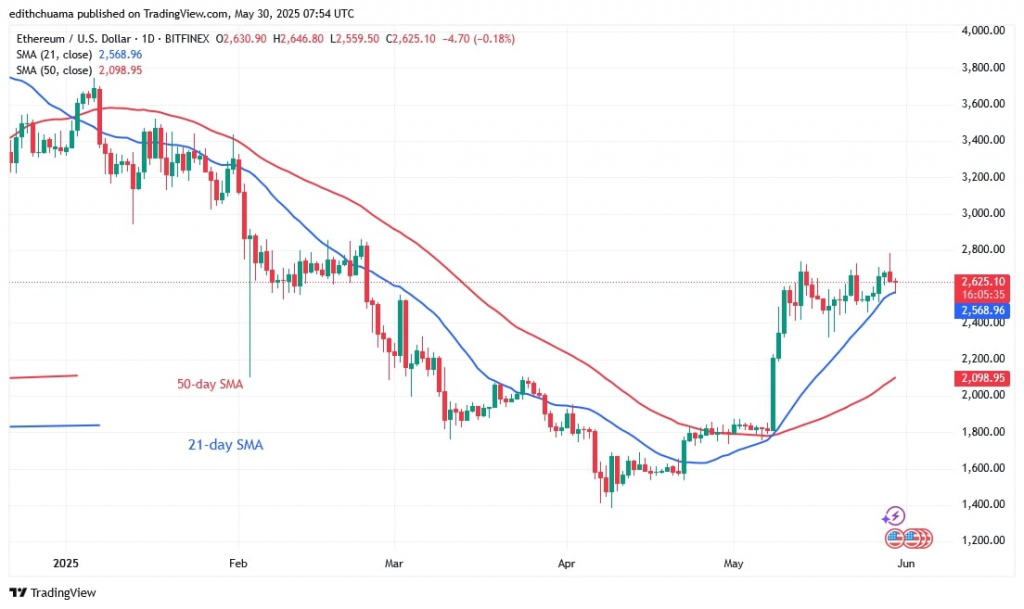
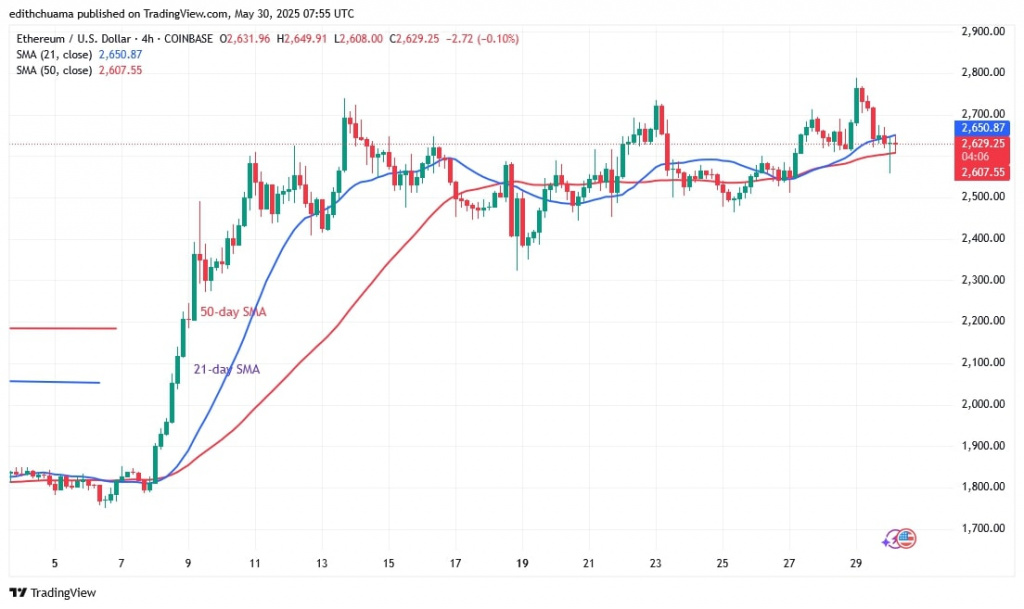
The Ethereum price has bounced back and forth between the $2,800 level and the 21-day SMA support since 13 May.
Ethereum price long-term analysis: bullish
The uptrend stalled at $2,737 on 13 May, forcing the largest altcoin to make a mandatory move above the moving average lines, according to Coinidol.com.
Today, the price of the cryptocurrency is bouncing as it retests the 21-day SMA support. Ether is expected to reach a high of $3,000 as the altcoin recovers and breaks through the $2,800 level.
On the other hand, Ether will fall above the 50-day SMA support or the low of $2,098 if the bears break the 21-day SMA support. In the meantime, Ether price continues to hold above the 21-day SMA support. It currently stands at $2,617.80.
Analysis of the Ethereum indicators
The upward moving average lines are below the Ether price bars. There is considerable buying pressure above the 21-day SMA support, as shown by the candlestick tails running across it. The horizontal moving average lines on the 4-hour chart show a sideways trend below the $2,800 level.
Technical Indicators:
Key Resistance Levels – $4,000 and $4,500
Key Support Levels – $2.000 and $1,500

What is the next direction for Ethereum?
Ethereum is anticipating a positive trend by trading above the moving average lines. The crypto price has retested the $2,800 level three times since 13 May but has been beaten back.
Ether price is rising above the 21-day SMA support and forming a long candlestick tail. Once the 21-day SMA support or the $2,800 barrier is broken, Ether price will start to rise.

Disclaimer. This analysis and forecast are the personal opinions of the author. They are not a recommendation to buy or sell cryptocurrency and should not be viewed as an endorsement by CoinIdol.com. Readers should do their research before investing in funds.


