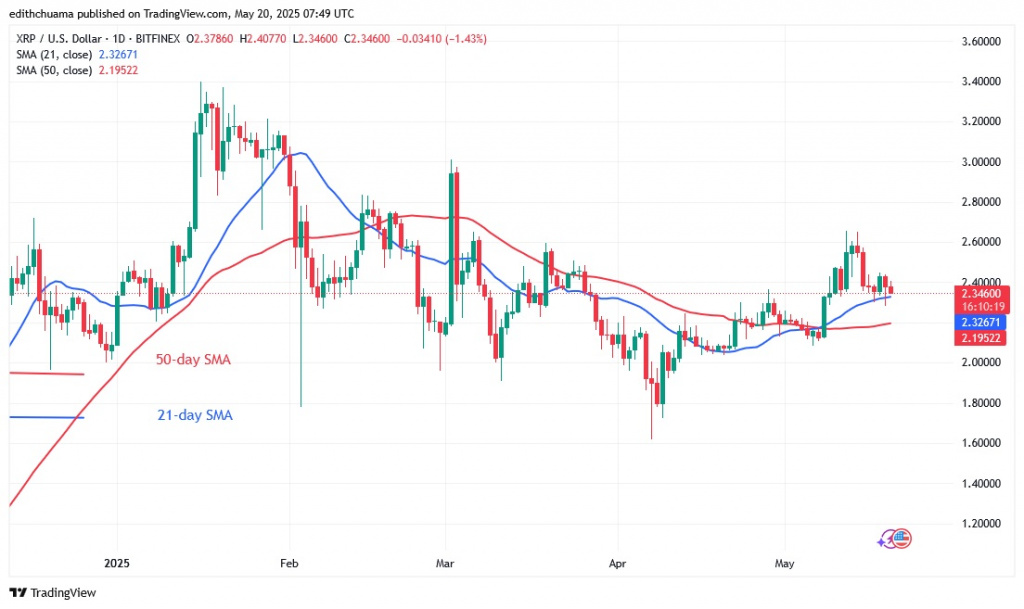
The latest price analysis by Coinidol.com report, the price of XRP has maintained its positive trend as it is above the 21-day SMA support.
XRP long term analysis: bullish
On May 12, the altcoin briefly climbed to a high of $2.65 before being rejected. XRP fell but was halted at the 21-day SMA support. Over the past 48 hours, the altcoin has been stuck between the 21-day SMA support and the $2.65 level. If the bears break the moving average lines, the cryptocurrency will drop to a low of $2.00. On the other hand, if the $2.65 level is broken, the altcoin will rise to $3.00. Nonetheless, XRP will continue to rise until the $2.00 support or the $2.65 barrier is breached. XRP is now worth $2.33.
XRP indicator analysis
A long candlestick tail broke through the 21-day SMA support and the cryptocurrency pulled back. It shows significant buying pressure at the 21-day SMA support. Currently, XRP has the potential to rise as the price bars are above the moving average lines. However, the altcoin will crash if the 21-day SMA support is breached.

Technical indicators:
Key resistance levels – $2.80 and $3.00
Key support levels – $1.80 and $1.60
What is the next direction for XRP?
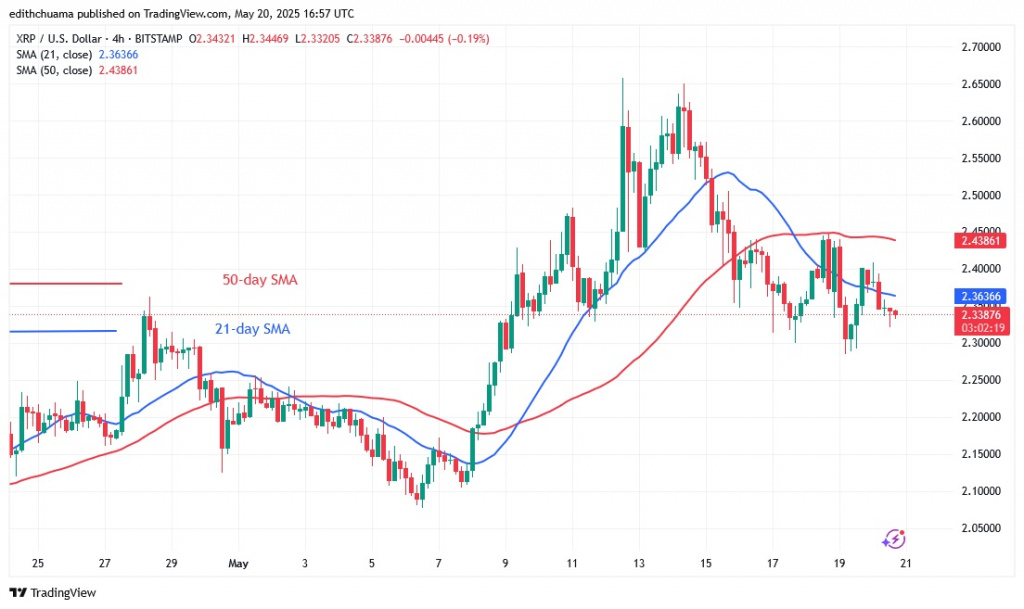
On the daily chart, XRP is trading between the 21-day SMA support and the resistance at $2.65. On the 4-hour chart, XRP is bearish below the moving average lines. The price of the cryptocurrency is trading above the support at $2.30 and below the moving average or resistance at $2.45. If the current support is breached, XRP will fall to $2.00.

Disclaimer. This analysis and forecast are the personal opinions of the author. They are not a recommendation to buy or sell cryptocurrency and should not be viewed as an endorsement by CoinIdol.com. Readers should do their research before investing.


